
Measuring Insider Trading
vibe coding my way to riches

Insider trading rules are a bit of a funny quirk of our financial system.
The C-level officers of a corporation often have important information that isn’t available to the general public (most importantly, they know the earnings before they’re publicly announced). So, in theory, it should be easy for them to beat the market. EG, if they have good earnings news, buy heavily before announcing it. If it’s bad, sell. EZ game.
The SEC (and the equivalent for most other countries) bans that sort of thing because it’s blatantly unfair, and it might create perverse incentives for, say, a CEO to purposely tank their stock so they can personally profit. But, you can’t actually prevent them from owning it at all, or making trades, because they’re usually one of the largest shareholders and they have to get paid too.
To square this circle, the SEC sets up specific rules about who can trade and when:
Anyone who is a director, officer, 10% shareholder, or anyone else with material insider knowledge is an “insider”
They must pre-clear their trades with the CEO
They can only trade in special windows: two days after quarterly earnings are announced, and then for 20 days only
All such trades then become public information
Overall this works pretty well, but not perfectly. Such rules are like a static fortification, and there’s always the chance that some clever, unscrupulous insider could find a workaround (or just straight up break the rules). To that end, people have built tools such as openinsider to monitor these sort of transactions… either as a public service watchdog, or hoping to personally profit by mirroring these trades.
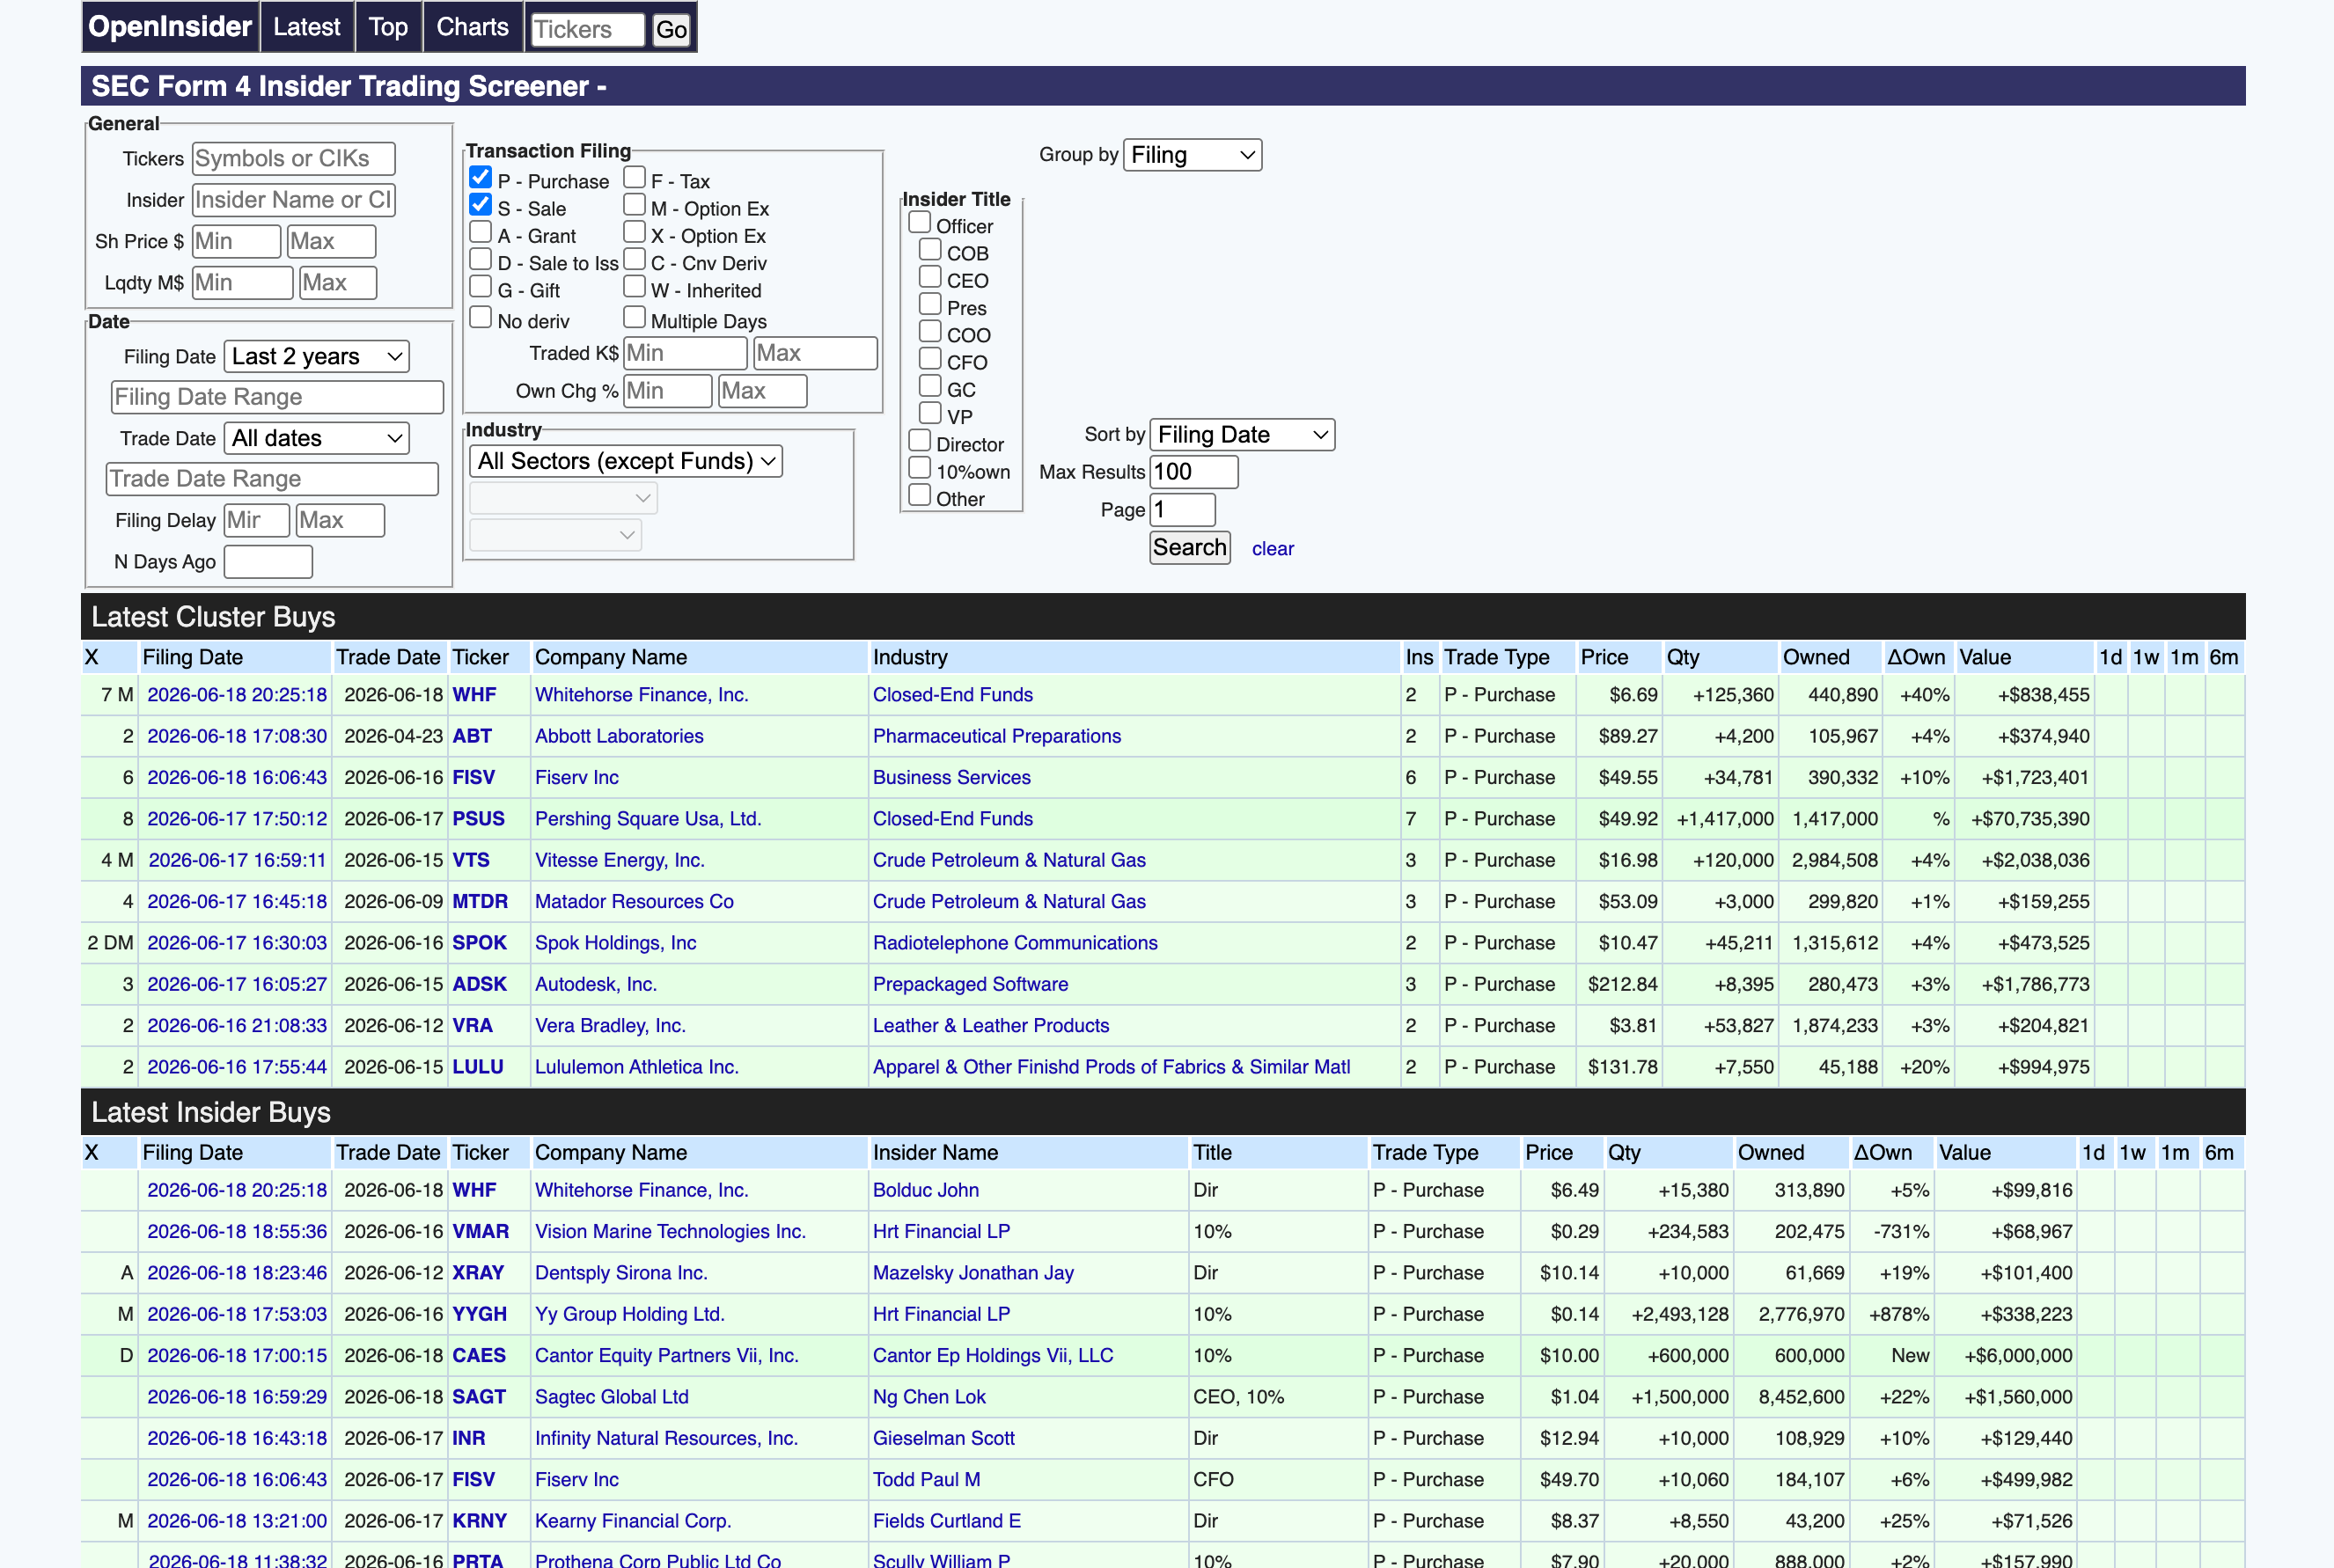
I coded a simple app that pulls insider trades from openinsider and then compares against immediate returns (measured by yahoo finance) to measure overall performance in the period immediately after when a corporate officer makes a big purchase. I also restricted it to look at relatively large purchases from relatively small stocks, which are the most suspicious. Initial results were… either excellent, or disappointing, depending on your point of view: average 1-week returns from a sample of 500 were only 51% winners (52% if I include non-CEOs), essentially random chance, suggesting that the insider trading rules were working quite well. Good for the country and the general public, but bad for people like me looking for extra returns.
However, when I changed it to look at returns after sales, I got a much stronger result: a staggering 73% win percentage from 1 week returns. This, if it’s true, would absolutely crush any sort of normal market return.
This raises the question… why such a large difference?
Well one catch… I fibbed a bit. Those “wins” were defined as when the stock price went up. Which is actually bad for someone who just sold on that day. So, if anything, this suggests that the insiders selling stock had unusually bad timing.
There is endless room to fiddle with details in these results. For example, restricting it to look at only purchases made in the past two years by people who own at least 10% of the stock resulted in a 1-week win rate of 53.8%, which is higher than random luck but not so high as to be suspicious.
I will continue to investigate this. I think the next step should be to automate a way to search across every dimension space, to find patterns, and to add other information sources to cross check. But does anyone have any suggestions?